Sooner or later, someone asks the question every software purchase must answer: is the CRM worth it? A CFO reviewing the budget, an owner reflecting on subscription costs, or a sales leader deciding whether to expand licenses will want evidence, not enthusiasm. Many teams struggle to answer because they never defined what success would look like, never captured a baseline, or tracked activity instead of outcomes.
Measuring CRM return on investment is entirely achievable with a thoughtful approach. This guide shows you how to establish baselines, choose the right metrics, calculate ROI with simple formulas, account for both hard and soft benefits, build reports that tell a convincing story, and avoid the traps that make CRM value look smaller or larger than it truly is.
What Is CRM ROI?
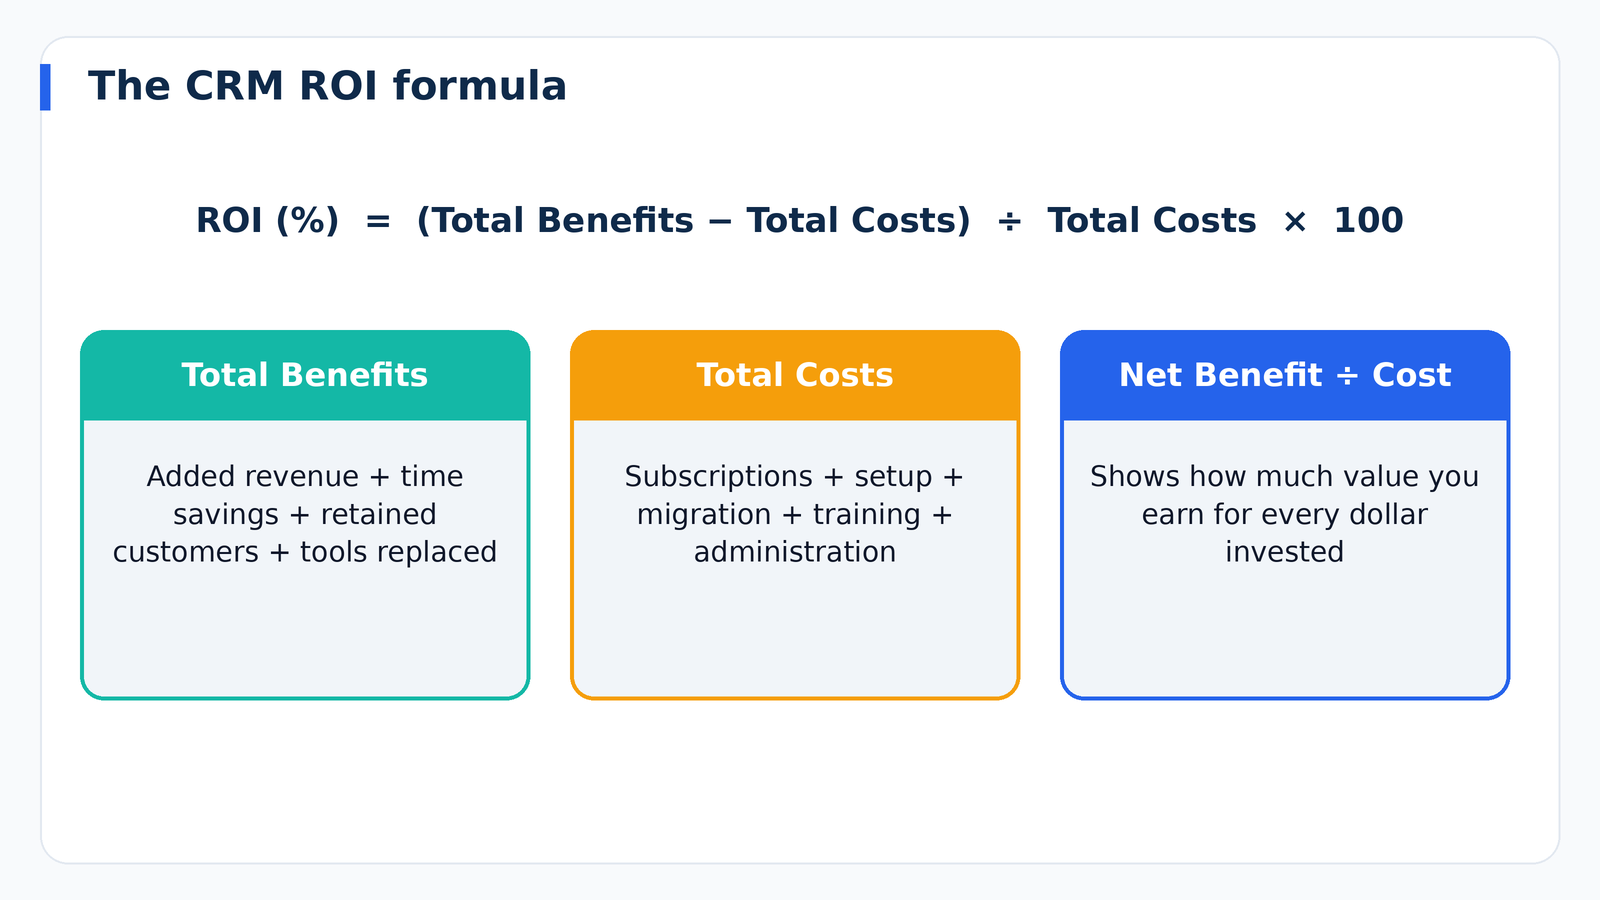
Return on investment compares the benefits you gain from an investment with its cost. The classic formula is:
ROI (%) = (Net Benefit ÷ Total Cost) × 100
where Net Benefit equals total benefits minus total costs. If a CRM costs a certain amount over a year and generates measurably more than that in added revenue and savings, the ROI is positive. The principle is simple. The challenge is deciding which benefits to count and how to measure them credibly.
Step 1: Calculate the Total Cost
Start with the cost side, because it is easier to measure and often underestimated. Include everything:
- Subscription or license fees for all users over the period.
- Implementation and setup, including partner or consultant fees.
- Data migration and cleaning work.
- Integrations and add-ons, such as connectors, extra storage, and premium support.
- Training time, valued at employees’ hourly cost.
- Administration, meaning the ongoing hours to maintain the system.
- Customization and improvements over time.
Using a three-year horizon often gives a fairer picture than a single year, because setup costs are front-loaded while benefits grow as adoption matures.
Step 2: Capture Baselines Before You Start
You cannot prove improvement without a starting point. Before launching, or as soon as possible if you have already launched, record baseline numbers for the metrics you hope to improve. Pull what you can from existing records, spreadsheets, and accounting data. Useful baselines include:
- Lead response time
- Lead-to-opportunity and opportunity-to-win conversion rates
- Average deal size
- Average sales cycle length
- Time spent on administrative tasks per rep
- Customer retention and renewal rates
- Support resolution time and satisfaction scores
- Forecast accuracy
If you lack historical data, estimate carefully and note that these are estimates. Later comparisons will still be informative as long as you are transparent.
Step 3: Identify and Measure the Benefits
CRM benefits fall into two categories: revenue gains and cost savings. Some are directly measurable, while others are indirect.
Revenue Benefits
Higher conversion rates. Faster follow-up and better qualification can improve the percentage of leads that become customers. Value the improvement by multiplying additional wins by average deal value and margin.
Larger deal sizes. Better insight into customer needs supports cross-selling and upselling. Compare average deal size before and after.
Shorter sales cycles. Faster closes improve cash flow and free capacity for more deals.
Improved retention. Seeing at-risk accounts and managing renewals proactively reduces churn. Retaining a customer preserves their future revenue, which is often more valuable than acquiring a new one.
Increased referrals and repeat business. Consistent follow-up with past customers generates additional revenue that might otherwise be missed.
Cost Benefits
Time savings. Automation of data entry, reporting, and routine communication returns hours to your team. Multiply hours saved by the loaded hourly cost of those employees.
Reduced tool costs. If the CRM replaces separate tools, such as standalone email software or spreadsheets, count the subscriptions you cancel.
Lower acquisition cost. Better lead source tracking helps you stop spending on channels that do not produce customers.
Efficiency in support. Faster resolution and fewer repeated questions reduce service costs.
Soft Benefits
Some value is harder to quantify but still real: better collaboration, smoother onboarding of new hires, improved morale from less admin work, stronger customer experience, and more reliable decision making. You may describe these qualitatively or assign conservative estimates, but be careful not to inflate the ROI with speculative numbers that would not survive scrutiny.
Step 4: Attribute Benefits Honestly
The hardest question in ROI analysis is attribution: how much of an improvement is due to the CRM versus other factors like a new product, market conditions, or a larger marketing budget? Perfect attribution is rare, but you can be reasonable and transparent.
- Use conservative estimates. If you are unsure how much of a gain is due to the CRM, count only a portion, such as half.
- Compare groups. If some teams adopted the CRM earlier or more thoroughly, compare their results with others.
- Look at before-and-after trends, while noting any other changes that happened simultaneously.
- Gather testimonials and examples. Specific stories, such as a large deal rescued by a timely reminder, complement the numbers.
A modest, defensible ROI is far more persuasive than a spectacular number that nobody believes.
A Worked ROI Example
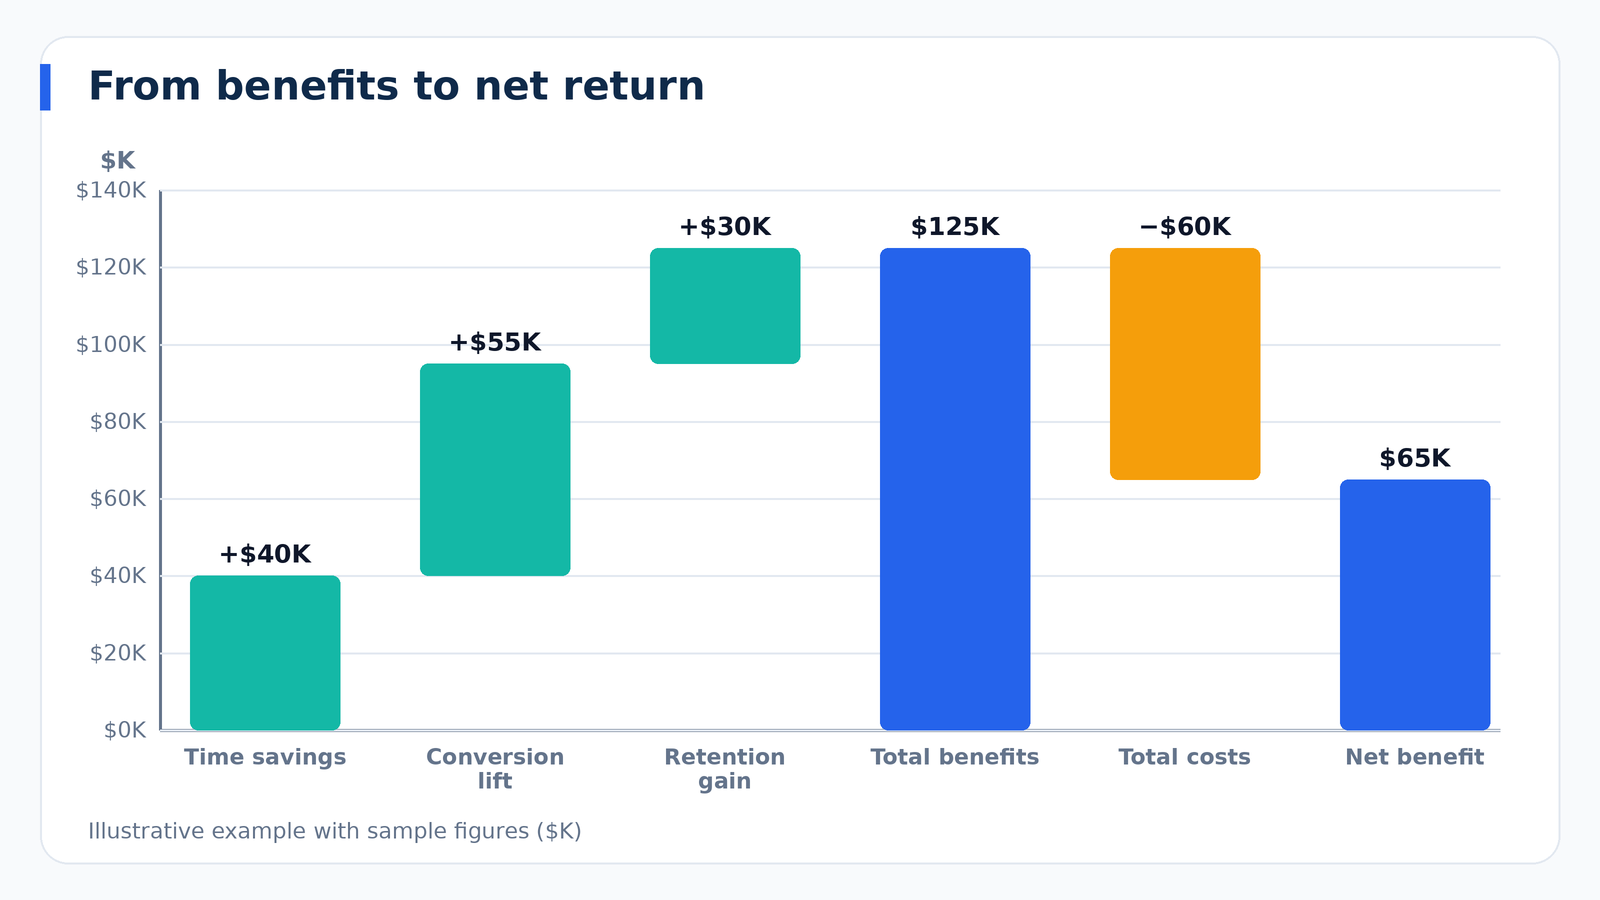
Consider a hypothetical company with ten salespeople. In the first year, it spends a total on subscriptions, setup, training, and administration. After adoption, it observes three improvements:
- Time savings. Each rep saves roughly three hours a week on admin and reporting. Over a year, that is a meaningful number of hours across the team, valued at the reps’ loaded hourly cost.
- Conversion lift. Faster lead response raises the win rate slightly. The added wins, multiplied by average deal value and margin, produce additional gross profit.
- Retention gain. Better renewal management saves a handful of accounts that would otherwise have churned, preserving their recurring revenue.
Add the value of these benefits, subtract total cost, and divide the result by total cost to get ROI. If the company is cautious and credits only a portion of the revenue gains to the CRM, the ROI will be lower but more credible. The exact numbers will vary by business, so the value of the exercise lies in the method: define, measure, attribute conservatively, and document your assumptions.
Key CRM Metrics and KPIs to Track
These indicators, tracked consistently, form the backbone of CRM performance reporting.
Sales Metrics
- Lead response time: how quickly new leads are contacted.
- Lead-to-customer conversion rate: the percentage of leads that become customers.
- Win rate: the percentage of opportunities that close as won.
- Average deal size and sales cycle length.
- Pipeline coverage and velocity: how much opportunity exists and how quickly it converts.
- Forecast accuracy: the gap between predicted and actual revenue.
Marketing Metrics
- Cost per lead and cost per acquisition: what you spend to generate leads and customers.
- Lead source performance: conversion and revenue by channel.
- Marketing-influenced pipeline and revenue.
- Campaign engagement: clicks, conversions, and unsubscribes.
Customer Success and Service Metrics
- Customer retention and churn rate.
- Customer lifetime value (CLV): the total revenue a customer is expected to generate.
- Net promoter score and customer satisfaction.
- First response and resolution time.
- Upsell and renewal rates.
Adoption and Data Quality Metrics
- Active users: the percentage of licensed users who log in weekly.
- Activity logged per user.
- Data completeness: the share of records with required fields filled.
- Duplicate rate.
Adoption and data quality are leading indicators. If they are weak, outcome improvements will be weak too.
Useful Formulas
Conversion rate = (Number of conversions ÷ Number of leads) × 100
Win rate = (Deals won ÷ Total deals closed) × 100
Customer acquisition cost (CAC) = Total sales and marketing spend ÷ New customers acquired
Customer lifetime value (CLV) = Average revenue per customer per period × Gross margin × Expected customer lifespan
Churn rate = (Customers lost during period ÷ Customers at start of period) × 100
Payback period = Total cost ÷ Monthly net benefit
Comparing CLV to CAC is especially powerful. A healthy business typically earns considerably more over a customer’s lifetime than it spends to acquire them, and a CRM that improves retention or reduces acquisition cost improves this ratio.
Building a CRM Performance Dashboard
A good dashboard tells a story at a glance. Design separate views for different audiences:
Executive view. Revenue versus target, pipeline coverage, win rate, retention, and ROI trend. Keep it to a handful of metrics.
Sales manager view. Pipeline by stage, stalled deals, activity levels, conversion by rep, and forecast versus quota.
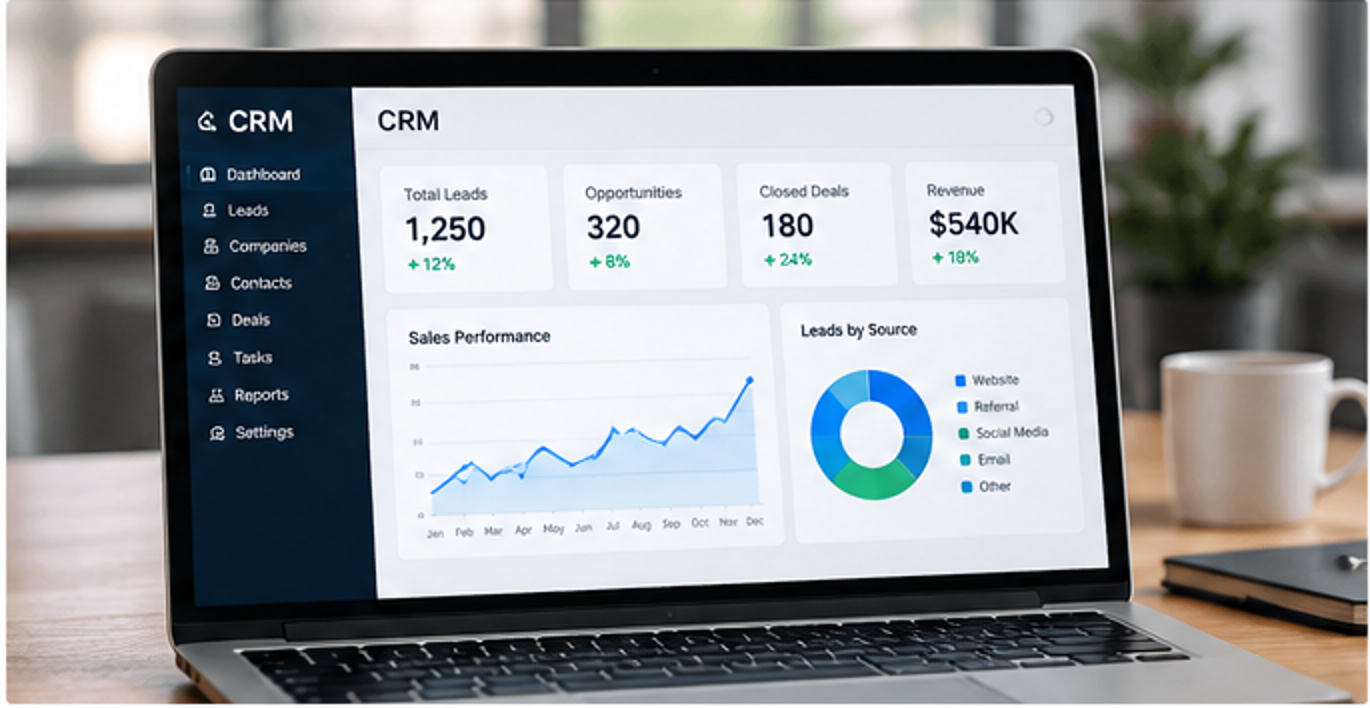
Marketing view. Leads by source, cost per lead, campaign performance, and marketing-influenced revenue.
Admin view. User adoption, data quality, duplicate rates, and integration health.
Review dashboards on a regular rhythm, such as weekly for operational metrics and quarterly for ROI. Include context, such as target lines and prior periods, so numbers have meaning.
Why CRM ROI Is Sometimes Disappointing
When the numbers are weak, the cause is usually not the software itself. Look for these common culprits:
- Low adoption. If users do not log in, benefits cannot appear.
- Poor data quality. Inaccurate records undermine reports and automation.
- Misaligned processes. The CRM may be configured around a process nobody follows.
- Too many features, too little focus. Complexity discourages use.
- No ownership. Without an administrator or champion, systems decay.
- Unrealistic expectations. A CRM does not replace strategy or fix a weak product.
- Measuring too early. Benefits often build over several months as habits form.
Treat disappointing results as diagnostic information. Interview users, examine adoption data, and make targeted improvements before concluding the investment failed.
How to Increase Your CRM ROI
- Drive adoption. Lead by example, simplify workflows, and make the CRM the only source of truth for meetings and reports.
- Automate high-volume tasks. Focus on activities that consume the most time.
- Integrate key systems. Reduce double entry and create a complete customer view.
- Keep data clean. Schedule regular audits and use validation rules.
- Use insights. Act on reports, such as reallocating budget to the best lead sources or coaching based on stage conversion.
- Train continuously. New features and new hires require ongoing education.
- Right-size licenses. Remove unused seats and avoid paying for unnecessary tiers.
- Review regularly. Reassess goals and configuration each quarter.
Presenting ROI to Leadership
When you share results, structure your message for decision makers. Begin with the business problem and goals, then show baselines and current performance, explain how you calculated benefits and what assumptions you made, present total costs transparently, and finish with the ROI, payback period, and recommended next steps. Include a few concrete stories to humanize the numbers. Acknowledge limitations and areas for improvement, which increases credibility. Leaders tend to trust analyses that show their work.
Frequently Asked Questions
How long does it take to see ROI from a CRM?
Some benefits, like time savings, appear within weeks. Others, such as improved retention and higher conversion, take several months or more. Many organizations assess ROI over twelve to thirty-six months.
What is a good CRM ROI?
There is no universal benchmark. A positive, defensible return that exceeds alternative uses of your budget is a good result. Focus on your own baselines and trends rather than comparing to industry claims you cannot verify.
Can small businesses measure CRM ROI?
Yes. Even tracking a few simple measures, such as leads responded to, deals closed, and hours saved, provides useful evidence.
Should soft benefits be included?
Mention them, but keep your core ROI calculation grounded in measurable benefits. Present soft benefits as supporting context.
Final Thoughts
Proving the value of your CRM does not require advanced analytics, just discipline. Calculate full costs, capture baselines, track a focused set of metrics, attribute benefits conservatively, and report results transparently. Pay attention to adoption and data quality, since they drive everything else. When you measure thoughtfully, you gain more than a number: you gain a roadmap for improving the system so it keeps delivering more value year after year.